This essay was originally published on Substack and is archived here as part of my ongoing work on political sentiment analysis.
Want to know what voters will care about next week? Stop watching the news. Start tracking the pressure.
Dec 18, 2025
This week, we launched a new feature inside the EyesOver Weekly Snapshot: three real-time indexes that measure exactly where voter stress is building — before headlines or polls catch up.
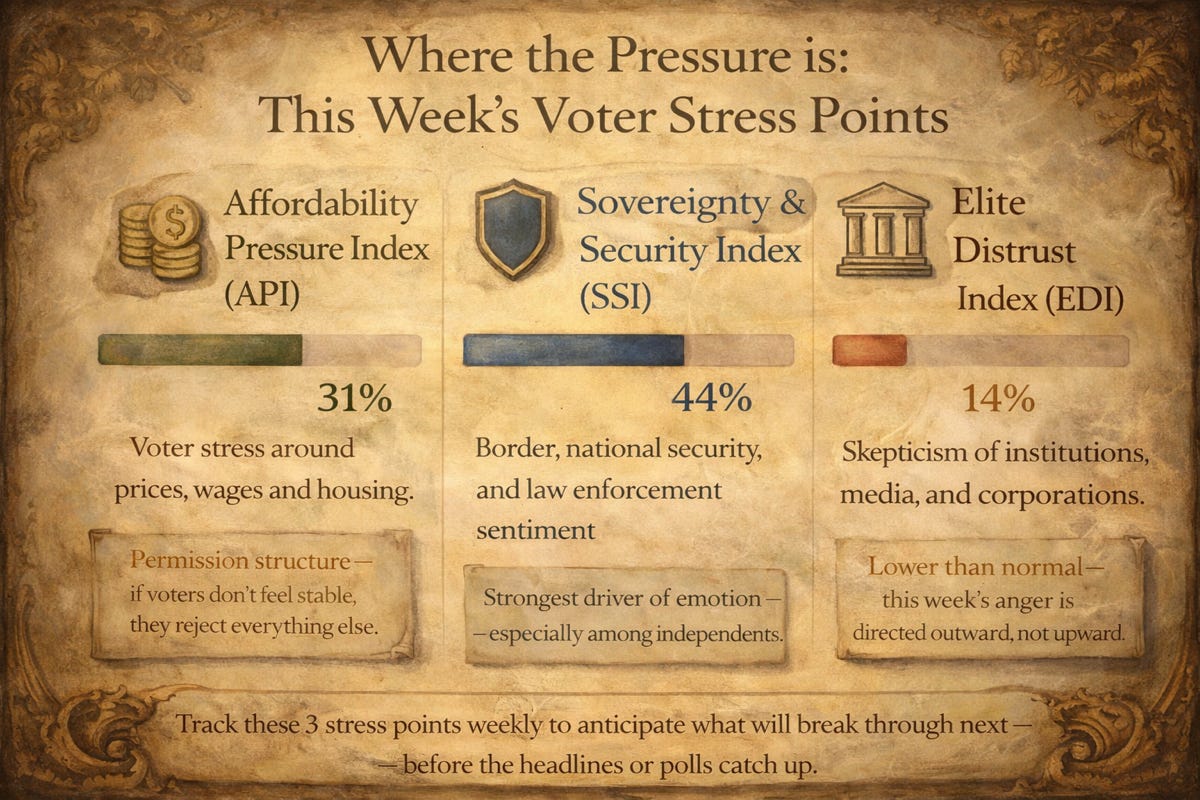
📊 Affordability Pressure Index (API)
🛡️ Sovereignty & Security Index (SSI)
🏛️ Elite Distrust Index (EDI)
You can see them in this week’s dashboard slide here.
These are not poll questions. They’re behavioral indicators, built on real-world voter activity: millions of posts, searches, videos, and interactions measured daily through the EyesOver system.
We’re now tracking these indexes weekly in the EyesOver Snapshot, and you’ll also see them featured in my Townhall column every Monday — because the 2026 midterms will be defined by who controls the pressure points, not the poll numbers.
Let’s break each one down:
1. 💸 Affordability Pressure Index (API): Voters Feel Like the Ground is Shifting Under Them
This index measures stress signals around prices, wages, housing, and cost-of-living narratives. It’s the permission structure for everything else. If voters don’t feel economically stable, they reject everything else — candidates, institutions, even their own party.
This week’s API: 31%: a moderate but rising number. This was prior to today’s CPI inflation report released this morning, which shows core inflation at 2.7% year-over-year, and I’d expect the index will rise even further next week.
📚 “Economic Voting in American Elections” (Markus & Converse, 1979) — one of the earliest findings that economic stress directly predicts voter volatility, especially in midterm cycles.
2. 🛡️ Sovereignty & Security Index (SSI): The Most Volatile Emotional Trigger on the Right
This index tracks intensity around borders, crime, law enforcement, terrorism, and security failures; everything from cartel violence to digital surveillance. And it’s not just policy. It’s identity.
This week’s SSI: 44%: the highest of the three indexes, driven in part by fentanyl-related news, the Thomas Crooks fallout (driven by Tucker Carlson podcast), Brown and Bondi Beach shootings, and perceived instability at the southern border.
Among independents and center-right voters, this remains the strongest emotional driver, especially when narratives connect immigration, crime, and perceived government failure into a single threat frame.
📚 “Threat, Authoritarianism, and Right-Wing Voting” (Hetherington & Suhay, 2011) — shows how fear-based messaging around sovereignty and law enforcement can rapidly mobilize right-leaning voters.
3. 🏛️ Elite Distrust Index (EDI): The Populist Pulse of the 2026 Electorate
This one is different. It doesn’t move with headlines. It moves when elites overstep, and when populists start punching back.
This week’s EDI: 14%, slightly lower than the average. That means voters are directing their anger outward (toward foreign threats, crime, the economy) instead of upward (toward the media, corporations, and political elites).
But don’t mistake a lull for irrelevance. In cycles like 2026, elite distrust is the kindling. When it spikes, it ignites entire coalitions.
📚 “The Rise of Populist Nationalism in the U.S.” (Norris & Inglehart, 2019) — finds that populist attitudes correlate most strongly with institutional distrust, especially among non-college whites and rural independents (voters essential to GOP turnout in 2026).
Why This Matters for 2026
Campaigns that only look at polling miss the pressure.
These indexes don’t predict vote share, they reveal the emotional scaffolding that supports it. When these signals spike, we consistently see a 3–5 day lead time before traditional polls move.
That’s why we’re building them into every EyesOver client dashboard. And that’s why I’ll be writing about them weekly in Townhall, because they explain voter behavior better than any crosstab, fav/unfav or “hard reelect” ever could.
So if you’re running a race, building a PAC, or just want to understand where voters are headed next…
👉 Watch the pressure.
We’ll show you where it’s building.
—
📬 Want these indexes in your inbox each week?
💼 Want to see what they mean in your area?
Book a demo — and let’s get you ready for 2026.

Leave a comment